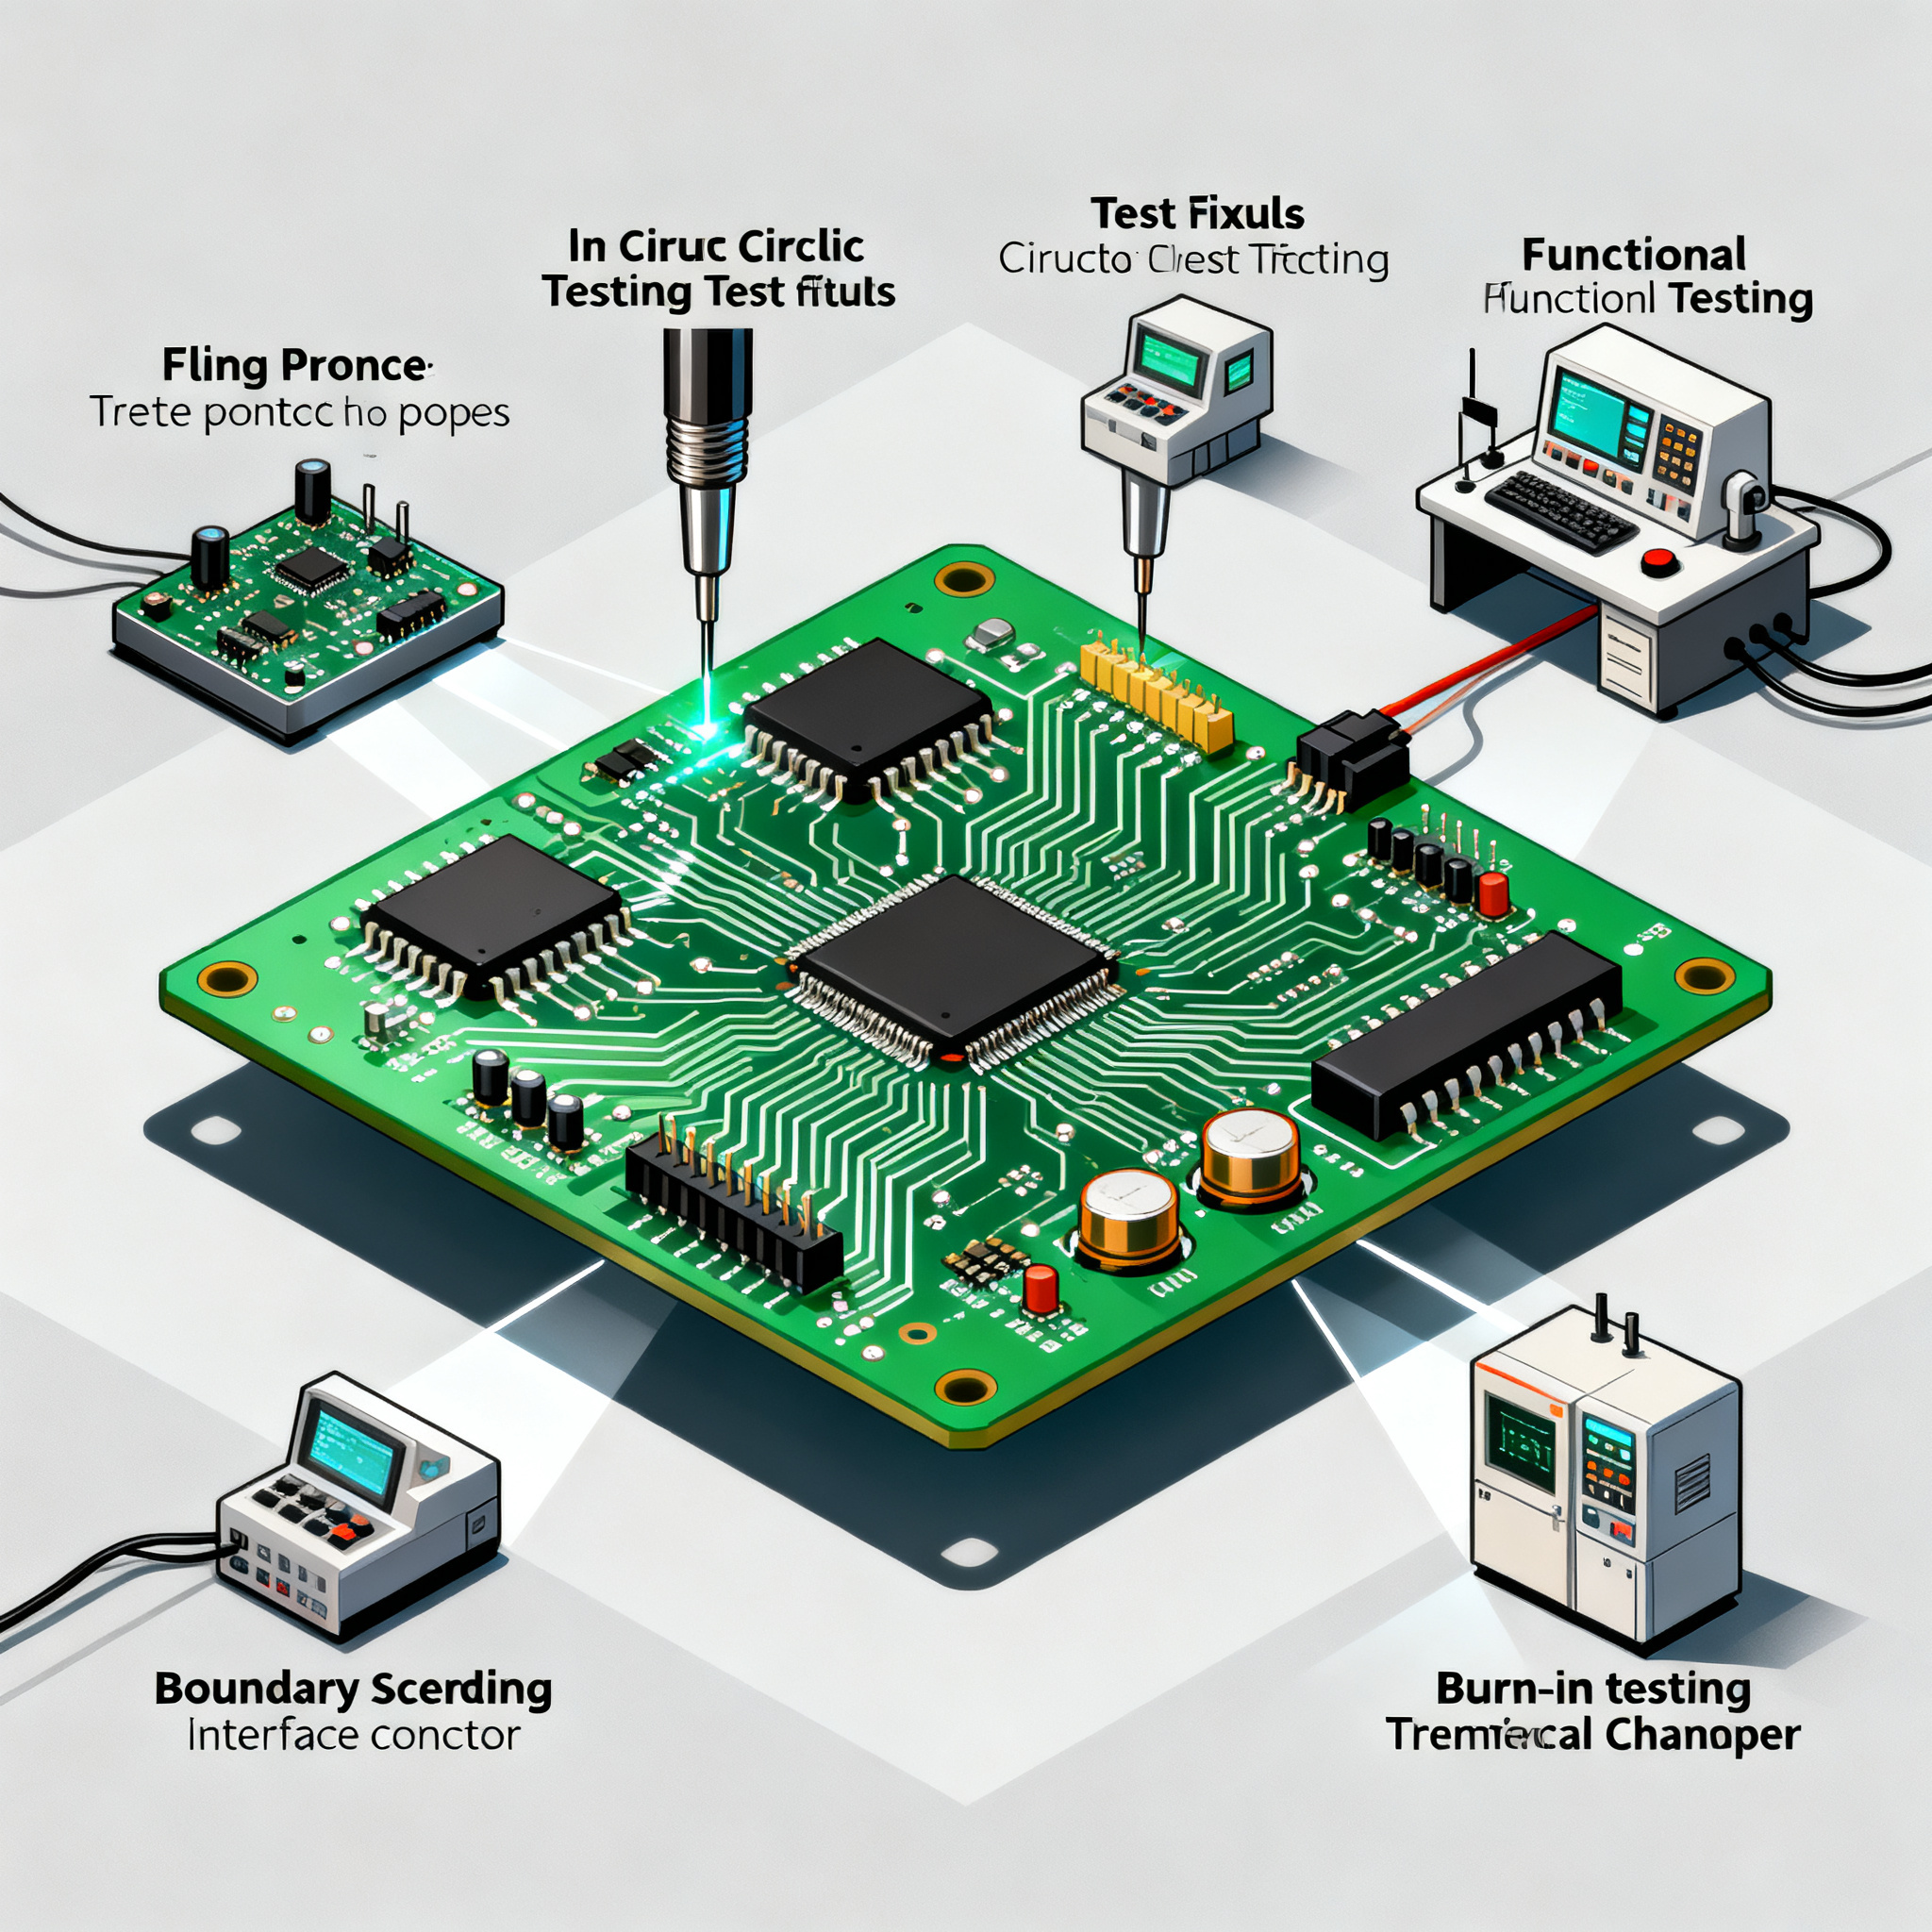
How to Select the Right PCB Testing Method: 5 Real-World Cases from Flying Probe to Burn-In Testing on 6-Layer Boards
The Real Cost of Getting PCB Testing Wrong: NPI Delays and Hidden Field Failures Testing is not an optional step—a single open trace or shorted pad can stop the entire system [source]. On a 6‑layer bo...
The Real Cost of Getting PCB Testing Wrong: NPI Delays and Hidden Field Failures
Testing is not an optional step—a single open trace or shorted pad can stop the entire system [source]. On a 6‑layer board, that simple truth multiplies rapidly: buried vias, fine‑pitch BGAs, and split power planes create defect opportunities that basic visual checks or a quick power‑on will never uncover. Every failure that escapes to the field costs exponentially more than catching it at the bench—yet many product teams treat test strategy as an afterthought, squeezing it between an over‑tight NPI schedule and a fixed launch date.
For a 6‑layer design, skipping the right test mix leads to repeated prototype spins, missed production ramps, and latent defects that surface only after weeks of thermal cycling in the customer’s environment. The engineering team burns a sprint debugging a “functional” anomaly that turns out to be a micro‑short in an inner layer; the buyer faces a cost‑down dilemma because in‑circuit test fixture amortization was never planned. Meanwhile, a competitor ships a product that simply does not fail. The difference is rarely component quality alone—it is intentional test coverage designed in from the first schematic revision.
PCB testing is not a binary pass/fail gate at the end of the line. It’s a continuum that starts with bare‑board electrical verification, moves through assembly inspection and in‑circuit checks, and extends to functional test and burn‑in when reliability requirements demand it [source]. For high‑density 6‑layer boards, the cost of the wrong method can equal 30–50 % of the total manufacturing re‑spin cost, not to mention the lost trust of a client who receives a DOA unit. This article shows you how to avoid that outcome—by comparing the major test methods side‑by‑side, illustrating real‑world cases on 6‑layer boards, and giving you a practical framework to select the right approach for your volume, complexity, and budget.
ICT vs. Flying Probe vs. Functional Test: A Head‑to‑Head Look at Throughput, Cost, and Defect Coverage
Three electrical test methods form the backbone of PCBA verification, and choosing among them—or combining them—depends on a clear understanding of what each can and cannot detect. In‑Circuit Testing (ICT) uses a fixed bed‑of‑nails fixture, making it extremely fast and cost‑effective for high‑volume production but carrying high upfront NRE and lead time [source]. Flying Probe Testing (FPT) is fixtureless, so changeover is instant and prototyping costs are minimal; it is ideal for low‑to‑mid volumes and design iterations [source]. Functional Test (FCT) simulates the real operating environment to verify that the assembly performs as a system—it catches defects that pass continuity and component‑value checks but cause logic or analog failures under load.
The table below breaks down the key trade‑offs across six dimensions that matter to an engineering buyer: initial investment, cycle time, defect spectrum, scalability, programming effort, and typical application sweet spot.
| Comparison Metric | ICT (Bed‑of‑Nails) | Flying Probe (FPT) | Functional Test (FCT) |
|---|---|---|---|
| Fixture / Setup Cost | High ($3k–$15k+ depending on node count); long lead time (2–6 weeks) [source] | Zero fixture cost; programming effort for initial test sequence (hours to days) | Custom test rig and software; cost varies widely with interface complexity |
| Cycle Time per Board | Seconds (typically 3–30 s) — the fastest electrical test | Minutes (2–10 min for a dense 6‑layer board with >300 nets) | Seconds to minutes, depending on test plan depth |
| Defect Coverage | Shorts, opens, wrong component, missing component, reversed polarity, value errors, solder bridges, basic semiconductor junction checks | Same electrical faults as ICT, plus finer probing of small pads and vias, but slower so node count is often limited by time | System‑level failures: timing, logic, analog performance, power sequencing, firmware interaction; may not isolate manufacturing defects to net level |
| Best Application | Stable designs with volumes >3,000–5,000 units/year; high‑reliability industrial/automotive where fixture cost is amortized | Prototypes, NPI runs, low‑volume production (1–500 boards), high‑mix manufacturing, quick‑turn validation [source] | Pre‑compliance verification, end‑of‑line system test, or when electrical test alone is insufficient to guarantee field performance |
| Programming Time | Initial fixture development and program debugging (1–3 weeks). Changes require fixture modification. | Test program created from CAD data; easy to update with design changes, often in a few hours | Substantial; requires functional specification, load boards, and scripting |
| Achilles’ Heel | Cannot access nodes without dedicated test pads; mechanical damage risk with fine‑pitch components; fixture becomes obsolete at layout change | Throughput drops linearly with net count; high‑node boards can become uneconomical above 1,000 units/year | Pass/fail criteria can mask marginal manufacturing defects; does not locate the exact component fault |
Tip: No single method catches all defects. Most mid‑to‑high‑reliability programs layer AOI (to spot visible assembly flaws), then an electrical test (ICT or FPT), and finally a functional test to confirm system‑level integrity. Burn‑in further weeds out early‑life failures for safety‑critical nodes. The art is matching the mix to your defect risk profile, not defaulting to the cheapest line item.
5 Real‑World Cases: Testing 6‑Layer Boards from Prototype Validation to Burn‑In
To make the decision concrete, here are five scenarios drawn from actual 6‑layer board projects. Each illustrates the trigger point where a particular test method became the right choice—and the defects it uncovered that a less‑targeted approach would have missed.
| Case | Board Type & Trigger | Primary Test Method(s) | Key Defect Spectrum Exposed | Business Outcome |
|---|---|---|---|---|
| 1. Early Prototype Validation | High‑speed digital board (DDR4, 6‑layer, 0.8 mm pitch BGA). Need to verify first‑article prototypes without waiting for a fixture. | Flying Probe (FPT) [source] | Open buried vias on address lines; high‑resistance microvia connections not visible to AOI | Prototype debug cycle cut from 3 weeks to 2 days; design‑for‑test improvements implemented before NPI ramp |
| 2. Pre‑Compliance Functional Verification | Mixed‑signal 6‑layer board with analog sensor front‑end and ARM processor. BGA, split analog/digital ground planes. | Functional Test (FCT) under load | Voltage droop on analog rail under CPU activity; power‑up sequencing violation that corrupted EEPROM | Passed EMC pre‑scan on first attempt; avoided a layout respin by identifying decoupling gaps early |
| 3. High‑Volume ICT on Industrial Controller | Industrial I/O controller, 6‑layer, TH and SMT mix. Production volume >5,000/month. Stable design after NPI. | In‑Circuit Test (bed‑of‑nails) [source] | Solder shorts on QFP pads, missing decoupling capacitors, reversed tantalum polarity | First‑pass yield improved from 82% to 97%; field return rate dropped 40% within 6 months; fixture ROI achieved in 4 months |
| 4. Burn‑In for Automotive Power Board | Automotive body control module, 6‑layer, high‑current MOSFET outputs. Customer AEC‑Q reliability demands zero infant mortality. | Burn‑In (temperature cycling + powered stress) per IPC‑TM‑650 [source] | Latent gate‑oxide defects in MOSFETs showing drift after 48 h at 85°C; PCB delamination at buried via sites | Intercepted 3% infant‑mortality batch before shipment; production line then applied sample burn‑in on each lot, preventing a costly recall |
| 5. Hybrid NPI‑to‑Ramp for Medical IoT Device | Wearable patient monitor, 6‑layer rigid‑flex, BGA processor + BLE module. Volume ramped from 200 pilot units to 20k/year. | AOI + FPT for prototypes & pilot; AOI + ICT at 3k/yr threshold; functional test throughout | Prototype: tombstones and lifted leads (AOI) + open blind vias (FPT). Volume: intermittent BGA opens caught by ICT; firmware regression caught by FCT | Seamless transition from NPI to volume manufacturing with zero field failures in the first 12 months post‑launch |
The cases above map directly to a fundamental truth: test selection is a dynamic, risk‑driven process. In Case 1, the rigid time‑to‑answer and zero‑fixture requirement made flying probe the only viable option. In Case 3, the fixture NRE was easily justified by the per‑board test time savings and the dramatic yield improvement. For the medical IoT device, the hybrid approach allowed the team to gain confidence on early builds without locking into a fixture, then smoothly transition as volume and design stability converged.
How to Match Testing Methods to Your Production Volume, Board Complexity, and Budget
Choosing the right test strategy for a 6‑layer board begins with three non‑negotiable inputs: projected annual volume, board technology density, and the reliability class your market demands. Only then can you build a sequence that balances coverage and cost.
| Volume Bracket | Board Complexity Indicators | Recommended Test Sequence | Typical Coverage Achieved | Notes |
|---|---|---|---|---|
| 1–100 units (prototype, NPI) | Any complexity; presence of BGAs, blind/buried vias, impedance‑controlled traces | AOI → Flying Probe (full netlist) → Functional test on a subset | AOI: 85–90% visual defects. FPT: 95%+ electrical faults. FCT: system‑level performance. | No fixture cost; design changes are inexpensive. Use FPT to verify inner‑layer continuity that AOI cannot see. |
| 100–3,000 units (pilot/low‑volume production) | Medium to high density; ≥2 BGAs, mixed signal, tight board real estate | AOI → Flying Probe → Functional test (100%). Consider ICT fixture if design is frozen and annual run rate rising. | Combined electrical + functional coverage >92%. AOI catches assembly errors before probing. | Tipping point for ICT feasibility; run break‑even analysis comparing FPT per‑board cost vs fixture amortization. |
| 3,000–20,000 units (volume ramp) | Stable design; high layer count, high IO count | AOI → ICT (bed‑of‑nails) → Functional test (sample or 100% depending on risk) | ICT: >90% structural coverage. FCT adds 3–5% system‑specific faults. | ICT fixture pays back in under 12 months. Ensure DFT rules were followed: test pads on every net, adequate clearance for probes, no vias under test points. |
| >20,000 units (high‑volume, automotive/medical) | Class 3, mission‑critical | AOI (100%) → ICT → Functional test (100%) → Burn‑In (sample or 100% for safety nodes) [source] | Near 99% defect containment with burn‑in screening out infant mortality. | Burn‑in profiles defined by IPC‑TM‑650; log failures per Weibull analysis to adjust screening duration. |
The framework above is not a rigid prescription but a decision‑support tool. The final mix must be validated against your own defect pareto. If field data shows a particular failure mode escaping ICT—say, BGA solder joint cracks due to board flex—you may need to add mechanical stress screening or boundary‑scan supplement. Likewise, an IoT device that receives OTA firmware updates might tolerate a slight reduction in electrical coverage if FCT thoroughly validates firmware boot and radio operation.
Design for Test (DFT) rules that make every method more cost‑effective:
- Place a test point (0.8–1.0 mm diameter pad) on every net; avoid sharing test pads with through‑hole leads if the pad must also serve as a probe target.
- Maintain at least 2.5 mm clearance from tall components (electrolytic capacitors, connectors) to allow vacuum‑actuated bed‑of‑nails probes to descend without collision.
- Route critical high‑speed nets on outer layers or bring them to test pads on top/bottom; buried stripline nets cannot be probed with flying probe without vias.
- Add probe access to all power rails and ground domains for impedance and isolation testing; use 0 Ω resistors or test points to isolate sections.
- Include boundary‑scan (JTAG) chains on complex digital ICs—this can dramatically reduce the node count that must be physically probed and increase diagnostic resolution.
When DFT is baked into the layout, the cost difference between a flying probe program and a full ICT fixture shrinks considerably because fixture complexity drops and test coverage rises with fewer “no‑access” nodes. Early DFT review with your assembly partner is one of the highest‑leverage activities an engineering team can undertake [source].
Testing Questions Engineers and Buyers Ask About 6‑Layer Boards
- Q: When should we switch from flying probe testing to ICT for a 6‑layer board?
- Typically, the transition makes economic sense when annual volumes exceed 3,000–5,000 units and the board design is stable—meaning no more layout changes that would obsolete the fixture. ICT’s upfront fixture cost ($3k–$15k) and 2–6‑week lead time are justified by sub‑second test times, while flying probe remains more economical for smaller batches and frequent design revisions. Perform a simple break‑even analysis: compare total test cost (fixture amortization + per‑board cycle time × cost rate) for ICT versus the cumulative per‑board time cost of flying probe over your volume forecast.
- Q: Can burn‑in testing really catch latent defects that ICT and flying probe miss?
- Yes. Burn‑in applies temperature cycling and voltage stress to accelerate early‑life failures (infant mortality) caused by weak solder joints, marginal components, or PCB delamination—defects that electrical tests alone rarely reveal. For example, a solder joint that passes continuity at room temperature may fracture after a few thermal cycles. IPC‑TM‑650 test methods define standard profiles [source]. While flying probe and ICT verify the “as‑built” electrical network, burn‑in mimics weeks of field stress in hours and is especially critical for automotive, aerospace, and medical devices where field failure is unacceptable.
- Q: How do I calculate the ROI of a bed‑of‑nails fixture vs continued flying probe for mid‑volume production?
- Compare the total life‑cycle cost of both approaches. For flying probe, multiply the average test time per board (e.g., 5 minutes) by your labor/machine rate, then by the number of boards you expect over the product’s life. For ICT, add the one‑time fixture cost plus a much lower per‑board test cost (e.g., 5 seconds × very low rate). Include the indirect cost of escape defects—each defective board that reaches the field may cost 10–100× more than a scrapped board. Typically, at 5,000 units, ICT yields a positive return within 6–12 months, but run the numbers with your specific rates, scrap costs, and warranty exposure.
- Q: What is the minimum test coverage recommended for high‑reliability 6‑layer boards in automotive applications?
- Automotive suppliers typically target greater than 90% test coverage using a combination of AOI, ICT, and functional test, plus thermal/burn‑in for safety‑critical nodes. Coverage metrics should be defined per IPC‑9701 or customer‑specific AEC‑Q requirements. “Coverage” usually refers to the percentage of potential fault types (stuck‑at, open, short, component value drift) that the test suite can detect. The remaining gap is often closed by statistical process control and sample reliability testing. For ASIL‑rated systems, redundancy and self‑test features on the board further raise effective field safety.
- Q: Do I still need AOI if I'm already using flying probe?
- Absolutely. AOI detects visible defects such as tombstoning, lifted leads, solder bridging, and missing components—often faster and with no physical contact. Flying probe checks electrical continuity and component values. The two methods are complementary: AOI finds assembly flaws early in the line before they reach the probe station, preventing waste of test time on boards that would fail electrically anyway; FPT verifies electrical integrity that AOI cannot see (e.g., undervoltage diodes, reversed polarized capacitors with correct orientation). Skipping AOI often results in higher repair costs and slower feedback to the SMT line.
- Q: How does IPC‑A‑610 Class 2 vs Class 3 affect our test pass/fail criteria?
- Class 3 (high‑performance/harsh‑environment) boards require tighter inspection limits—for instance, less voiding in BGA joints (typically <25% vs. <30% for Class 2), smaller fillet deviations, and fewer allowed defects in plated through‑holes. This directly raises test thresholds. Your test strategy must embed these acceptance criteria in both visual and electrical inspection routines. A board that passes electrical test may still violate Class 3 solder joint integrity under 500× magnification, so AOI and X‑ray parameters must be tuned accordingly [source]. If your product’s environment demands Class 3, the entire test flow—from paste inspection to FCT—must reflect that rigor.