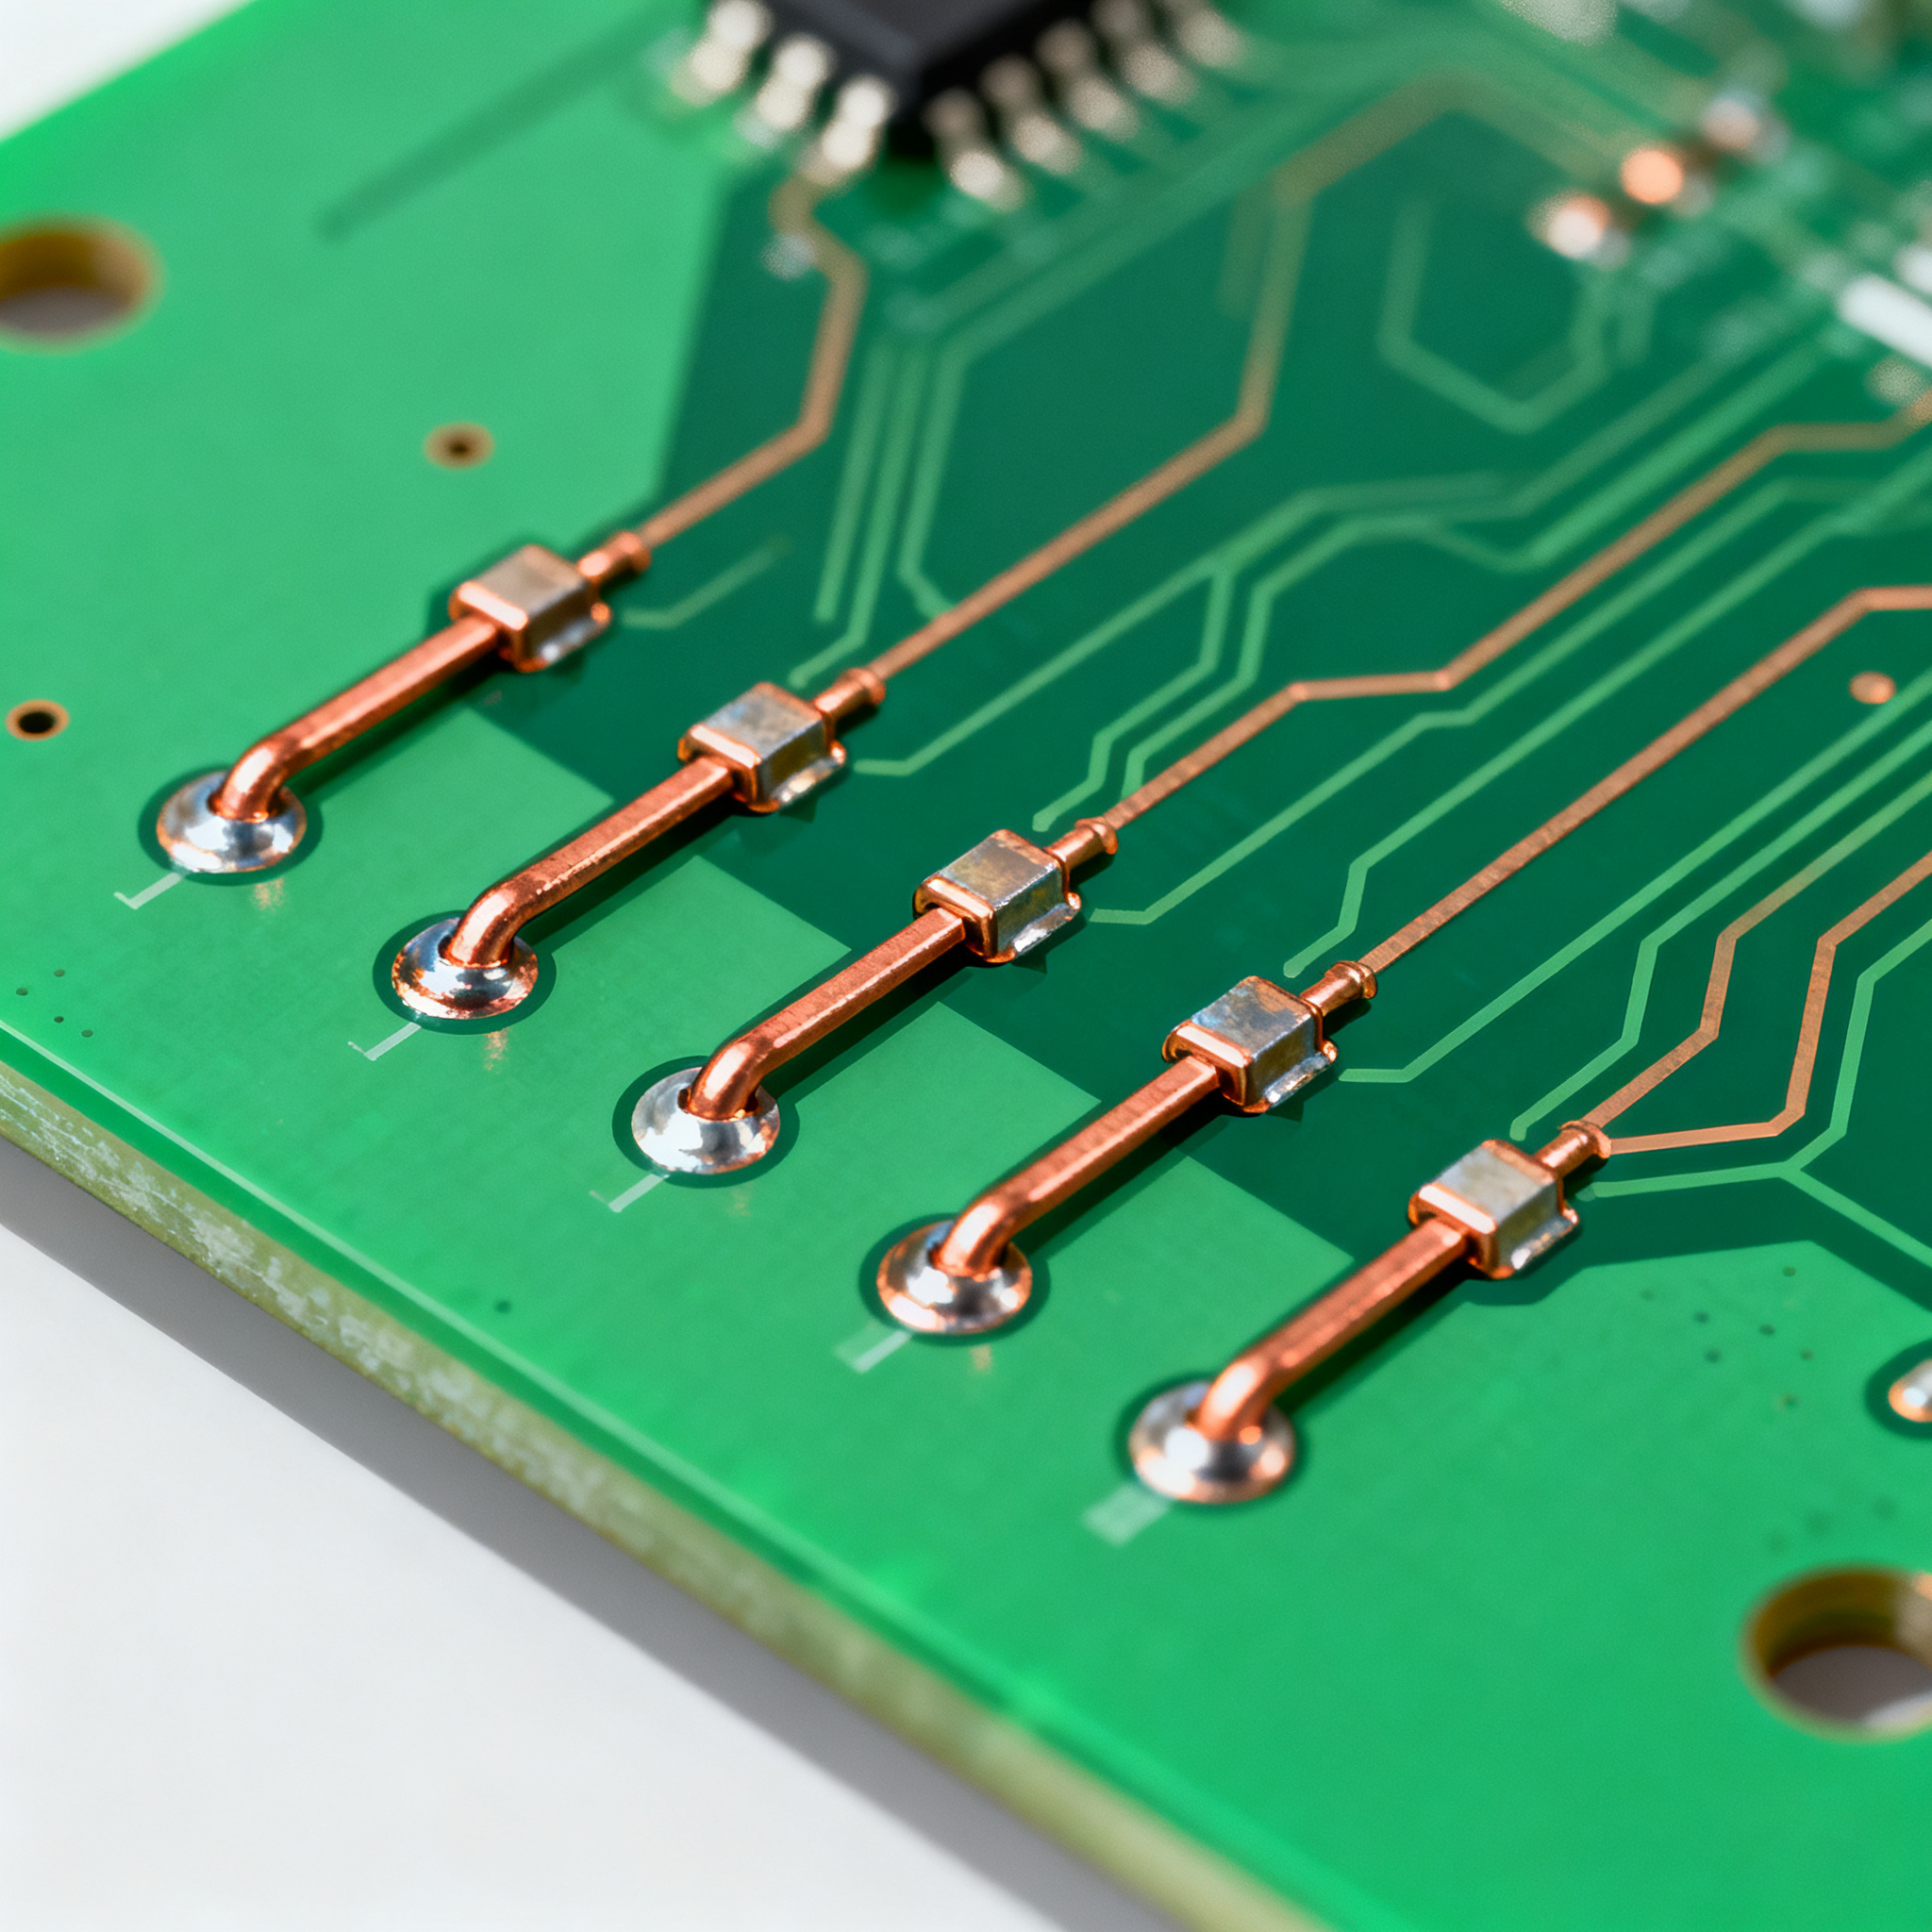
Avoiding 5 Common Solder Bridging Defects in Final PCB Assembly
End PCB Assembly Nightmares: How to Avoid 5 Common Solder Bridging Defects Why Solder Bridges Still Wreck Final PCB Assembly Yields (and How One Tiny Short Can Take Down a Board) You've likely seen it...
Why Solder Bridges Still Wreck Final PCB Assembly Yields (and How One Tiny Short Can Take Down a Board)
You've likely seen it on a post-reflow inspection report: a hair-thin filament of solder spanning two adjacent pads on a 0.4mm-pitch QFN, invisible to the naked eye but catastrophic once the board powers up. Solder bridging remains the single most prevalent defect in fine-pitch SMT assembly, and it shows no sign of disappearing as component densities climb and pad geometries shrink. The team at JLCPCB defines solder bridging as an IPC-A-610 unacceptable condition — meaning any assembly exhibiting a bridge, regardless of function or location, fails inspection. That classification is absolute.
The numbers underscore the severity. AOI systems operating at 15-micron resolution, like those deployed by MicroLOGIX, routinely detect solder bridges on 0.4mm-pitch QFN components that manual inspection misses entirely. Their published findings show that even experienced inspectors catch fewer than 60% of fine-pitch bridges when relying on visual methods alone. A single undetected bridge on a high-reliability board — an automotive ECU, a medical infusion pump controller, or an aerospace telemetry module — can trigger field failures that cost orders of magnitude more than the entire assembly run.
What makes solder bridges particularly insidious is the variety of ways they form. BENCOR's visual defect guide highlights a frequently overlooked mechanism: a misaligned component pressing down on solder paste during placement, squeezing it laterally until it contacts a neighboring pad. The bridge doesn't appear until reflow, when the displaced paste melts and wets both conductors. By then, you're looking at rework or scrap — neither of which is cheap on a 12-layer board with buried vias.
Key Takeaway: Solder bridging is not a single-root-cause problem. It's a system-level failure mode that spans stencil design, paste chemistry, placement accuracy, and reflow dynamics. Addressing it requires understanding every link in that chain.
The Anatomy of a Solder Bridge: From Stencil to Reflow
Solder bridge formation follows a predictable mechanical chain, and each link offers an intervention point. The chain begins with stencil aperture geometry and ends with molten solder wetting behavior during reflow. Understanding this sequence is what separates a process engineer who reacts to defects from one who designs them out before the first panel hits the line.
Stencil aperture area ratio is the first domino. IPC-7525 recommends an area ratio above 0.66 for consistent paste release. When the ratio drops below this threshold — common on fine-pitch apertures where stencil thickness remains fixed — paste transfer becomes erratic. Some pads receive excess paste; others starve. The pads with excess volume are prime candidates for bridging. Regular stencil printing audits that verify area ratios on every aperture are not optional; they are the single highest-return process control for fine-pitch assemblies.
Next comes copper weight and surface finish. FCT Solder has documented how outer-layer copper weight directly affects printability. Heavier copper (2 oz. or more) creates taller pad profiles that reduce the effective gap between adjacent pads, narrowing the solder mask dam and increasing bridging risk. Surface finish matters too — ENIG and immersion silver present flatter surfaces that promote uniform paste printing, while HASL's natural dome shape can concentrate paste toward pad centers, which is generally beneficial for bridging control but can create co-planarity challenges for fine-pitch components.
Placement force and component alignment close the pre-reflow portion of the chain. Even a 50-micron placement offset on a 0.4mm-pitch device can compress paste asymmetrically, creating the squeeze-out that BENCOR identifies as a hidden bridge initiator. The bridge may not be visible until the paste slumps during preheat and wets both pads during peak reflow.
Reflow dynamics complete the story. Insufficient preheat soak can cause paste vehicles to volatilize unevenly, leading to hot slump where paste collapses and spreads before the flux activates. Conversely, an overly aggressive ramp rate can cause the same effect through thermal shock. Seeed Studio's reference imagery of ideal versus bridged joints provides a visual benchmark that every process engineer should keep on hand — the difference between a properly formed fillet and a bridged connection often comes down to a 5°C change in peak temperature or a 10-second adjustment in time above liquidus.
The table below maps the primary root causes of solder bridging to the process parameters and standards that govern them, giving you a reference for troubleshooting when defects appear on your line.
| Root Cause | Primary Mechanism | Governing Standard / Parameter | Typical Failure Threshold | Mitigation Approach |
|---|---|---|---|---|
| Stencil aperture area ratio too low | Erratic paste transfer; excess volume on some pads | IPC-7525 area ratio ≥ 0.66 | Bridging rate rises sharply below 0.6 | Reduce stencil thickness or widen aperture; step-down stencil for fine-pitch zones |
| Excessive outer-layer copper weight | Tall pad profiles reduce inter-pad gap; solder mask dam thins | Copper weight (oz.), pad height above laminate | 2 oz. copper and above; pad height > 70 µm | Specify 1 oz. copper on fine-pitch outer layers; verify mask dam ≥ 0.1mm |
| Inadequate pad-to-pad spacing | Molten solder wets across narrow gap during reflow | IPC-7351 land pattern; DFM spacing rules | Spacing < 0.15mm for 0.5mm pitch; < 0.1mm for 0.4mm pitch | Enforce minimum spacing in DFM checks; use solder mask dams |
| Component placement misalignment | Paste squeeze-out from offset placement force | Placement accuracy (µm); pick-and-place calibration | Offset > 50 µm on 0.4mm pitch | Validate placement precision; use fiducial correction per panel |
| Reflow profile — hot slump | Paste collapses and spreads before flux activation | Preheat ramp rate; soak time; paste vendor profile | Ramp > 2.5°C/s; soak < 60s for water-soluble paste | Optimize ramp to 1.5–2.0°C/s; extend soak for no-clean paste |
| Solder mask dam missing or insufficient | No physical barrier between adjacent pads | Solder mask dam width ≥ 0.1mm; IPC-SM-840 | Dam < 0.075mm; LPI mask resolution limit | Specify dam width in fab drawing; confirm with CAM review |
| Excess paste volume from stencil overprint | Paste slumps beyond pad boundary during reflow | Stencil aperture reduction; paste type factor | Volume > 120% of pad area for fine-pitch | Apply aperture reduction (80–90% of pad area) for pitches < 0.5mm |
| Surface finish topography (HASL dome) | Uneven paste deposit; paste pooling at pad edges | Surface finish flatness; co-planarity | HASL dome height variation > 15 µm | Select ENIG or immersion Ag for pitches < 0.5mm |
Each of these root causes rarely acts in isolation. In practice, you'll find that a board with 2 oz. copper and marginal pad spacing also has a stencil running at an area ratio of 0.58 on the fine-pitch apertures. When bridging appears, investigate the combination — not just one variable. The interaction between copper weight, pad geometry, and stencil design is where most chronic bridging problems hide.
AOI vs. X-ray vs. Manual Inspection: Which Method Catches Hidden Bridges on 0.4mm Pitch?
Inspection strategy is where engineering judgment meets economic reality. You can't inspect quality into a board, but you can absolutely fail to detect bridges that your process produced. Choosing the right inspection method — or combination of methods — depends on your component mix, throughput requirements, and the consequence of an undetected short.
MicroLOGIX's published experience with 15-micron AOI systems provides a compelling data point: on 0.4mm-pitch QFNs, their AOI catches bridges that trained manual inspectors miss entirely. The reason is straightforward. At 0.4mm pitch, the gap between pads is roughly 0.2mm, and a bridge filament may be as thin as 50–75 microns. The human eye, even with magnification, struggles to resolve that consistently across thousands of joints per board. AOI, operating at 15-micron resolution with consistent lighting and algorithmic comparison to a golden board, delivers repeatable detection.
PCBandAssembly's workflow guidance reinforces this: AOI should be the primary gate for solder bridge detection, with manual inspection serving as a secondary verification for flagged anomalies rather than a standalone screening method. This two-tier approach balances throughput and accuracy — AOI scans every board at line speed, and operators review only the flagged images, dramatically reducing escape rates while keeping labor costs manageable.
But AOI has a fundamental limitation: it can only see what's optically accessible. Seeed Studio's visual defect reference shows that bridges on the outer rows of BGAs and QFNs are visible to AOI, but bridges under the package body — between inner rows of a BGA, for example — are completely hidden. That's where X-ray inspection becomes non-negotiable. For 0.3mm-pitch micro-BGAs, 0.4mm-pitch leadless packages with hidden terminations, and any component where the solder joint is not optically accessible, X-ray is the only reliable detection method.
The comparison table below breaks down the three inspection methods across the metrics that matter most for solder bridge detection on high-density assemblies.
| Comparison Metric | AOI (Automated Optical Inspection) — 15 µm Resolution | X-ray Inspection (2D/3D) | Manual Visual Inspection (Microscope) | Selection Criteria & Failure Boundary |
|---|---|---|---|---|
| Minimum detectable bridge width | ~15–25 µm at 15-micron pixel resolution | ~5–10 µm, depending on tube voltage and detector | ~50–75 µm under 20x magnification; operator-dependent | For 0.4mm pitch and below, manual inspection is insufficient. AOI at 15 µm is the minimum viable resolution. |
| Detection on 0.4mm-pitch QFN outer rows | High — consistent detection; MicroLOGIX confirms 95%+ catch rate | High — but throughput is slow; use for verification, not 100% screening | Moderate — < 60% catch rate per MicroLOGIX data; fatigue degrades performance | AOI is the correct primary gate for exposed QFN rows. Manual is supplemental only. |
| Detection under BGA / micro-BGA inner rows | None — optically blocked by package body | High — 2D X-ray reveals bridging; 3D CT resolves layer-by-layer | None — no optical access | X-ray is mandatory for any BGA with pitch ≤ 0.5mm where inner-row bridges are possible. |
| Throughput (boards per hour) | 60–200+ boards/hour, depending on board complexity and camera count | 5–30 boards/hour for 2D; 1–5 boards/hour for 3D CT | 10–30 boards/hour per inspector; highly variable | AOI matches line speed. X-ray is a sampling/bottleneck tool. Manual does not scale. |
| Relative equipment cost | $80K–$250K for production-grade systems | $150K–$600K+ for 2D; $400K–$1M+ for 3D CT | $5K–$20K for inspection microscope | Cost must be weighed against escape cost. One field failure on a high-reliability board can exceed the cost of an AOI system. |
| False-call rate on fine-pitch bridges | Low to moderate — well-tuned algorithms achieve < 5% false calls | Low — but operator interpretation required for ambiguous images | High false-negative rate — bridges are missed, not falsely flagged | AOI false calls are preferable to manual false negatives. Tune algorithms conservatively for bridge detection. |
For most production environments assembling boards with 0.4mm-pitch components and above, the optimal strategy is AOI as the primary inline inspection gate, manual review of AOI-flagged images for disposition, and X-ray on a sampling basis for BGA and leadless packages — with 100% X-ray reserved for Class 3 high-reliability assemblies where the cost of escape justifies the throughput penalty. If your product mix includes 0.3mm-pitch micro-BGAs, X-ray moves from sampling to mandatory, and the conversation shifts from "should we invest" to "which system meets our throughput and resolution requirements."
5 Design and Process Tweaks That Eliminate Solder Bridges Before They Form
The most cost-effective solder bridge is the one that never forms. Rework is expensive, inspection is a detection net, but design-phase prevention costs nothing compared to the downstream consequences of a process that produces bridges. Here are five concrete, actionable tweaks that span the design-to-production boundary — because the engineers who design boards and the buyers who source assembly need to speak the same language when it comes to bridging risk.
1. Enforce Minimum Pad-to-Pad Spacing and Solder Mask Dams
PCBCart's DFM guidance is unambiguous: applying proper gap spacing between solder pads and ensuring solder mask dams are correctly defined are the two highest-impact design decisions for bridging prevention. For 0.5mm-pitch QFPs, a minimum pad-to-pad spacing of 0.15mm combined with a solder mask dam of at least 0.1mm provides a physical barrier that molten solder cannot easily cross. For 0.4mm pitch, you're working with tighter margins — 0.1mm spacing and 0.075mm mask dams are the practical minimums, but every additional micron of spacing and dam width reduces bridging probability. DFM checks should flag any design that violates these thresholds before the Gerber files leave your CAD tool.
Tip: If your fab house tells you they can't maintain a 0.1mm solder mask dam on a particular layer, believe them. LPI (liquid photoimageable) solder mask has resolution limits, and attempting to push beyond them results in broken dams that offer zero protection. Adjust pad geometry or copper weight to accommodate the fab's actual capability.
2. Control Paste Volume Through Stencil Aperture Reduction
JLCPCB's stencil design recommendations include aperture reduction as a primary method for reducing solder paste volume on fine-pitch pads. By reducing the aperture opening to 80–90% of the pad area, you limit the total paste volume deposited while maintaining the aperture area ratio above 0.66. The key is to reduce the aperture symmetrically — shrinking the width while preserving the length — so that paste release remains uniform and the resulting solder joint retains adequate volume for reliability. Combined with precise stencil alignment (maintained through regular stencil tension checks and printer calibration), aperture reduction eliminates the excess paste that drives bridging without starving the joint.
3. Maintain Stencil Aperture Area Ratio Above 0.66
This is the single most quantifiable predictor of solder bridging risk. IPC-7525's area ratio guideline of 0.66 is not arbitrary — it represents the threshold below which paste release becomes inconsistent, leading to erratic deposit volumes. Process audits consistently show a sharp upward inflection in bridging rates when the area ratio drops below 0.6. For a given aperture width (W) and stencil thickness (T), the area ratio is W/(2T). On a 0.12mm-thick stencil, an aperture narrower than 0.158mm violates the 0.66 threshold. If your fine-pitch pads require apertures narrower than that, you need a thinner stencil — or a step-down stencil that locally reduces thickness in the fine-pitch zone. Regular stencil printing audits that measure area ratios on every aperture are the most effective process control for fine-pitch assemblies.
4. Validate Component Placement Precision to Avoid Paste Squeeze-Out
BENCOR's identification of component squeeze-out as a bridge initiator deserves more attention than it typically receives. The mechanism is mechanical: a placement nozzle descends with a specified force, and if the component is offset even slightly from the paste deposit, the paste is compressed laterally. On a 0.4mm-pitch device, that lateral displacement can close the gap to the adjacent pad before reflow even begins. The fix is twofold: first, verify that your pick-and-place machine's placement accuracy is appropriately specified for the finest pitch on your board (typically ±35 µm or better for 0.4mm pitch), and second, ensure that fiducial correction is applied per-panel, not just per-board, to account for panel-level variations. Placement force should also be calibrated — excessive force amplifies the squeeze-out effect, while insufficient force can cause the component to float during reflow. Both extremes create defects.
5. Run Design Reviews That Include Edge-Case Bridging and Tombstone Risk
Standard DFM checks look at pad spacing and mask dams, but a thorough design review for bridging risk goes further. It examines whether the combination of copper weight, surface finish, pad geometry, and component pitch creates conditions where bridging is probable even if each individual parameter passes its threshold. For example, 2 oz. copper with ENIG finish on a 0.5mm-pitch QFP may pass individual DFM checks, but the taller pad profile from heavier copper reduces the effective gap, and ENIG's flat surface promotes uniform wetting that can draw solder across the gap. A design review that catches this interaction before fabrication can recommend a copper weight reduction or a mask dam specification that compensates. The review should also include tombstone risk on small passives (0201, 0402), since tombstoning and bridging share root causes in pad geometry and paste volume imbalance.
Quick Checklist for Engineers and Buyers:
- Pad-to-pad spacing meets minimum thresholds for every pitch on the board (≥ 0.15mm for 0.5mm pitch; ≥ 0.1mm for 0.4mm pitch)
- Solder mask dam width ≥ 0.1mm between all adjacent pads; fab house has confirmed capability
- Stencil aperture area ratio ≥ 0.66 on all apertures; step-down stencil specified if needed
- Aperture reduction applied (80–90% of pad area) for pitches below 0.5mm
- Outer-layer copper weight ≤ 1 oz. on fine-pitch layers; ENIG or immersion Ag specified for pitches < 0.5mm
- Pick-and-place accuracy verified for the finest pitch on the BOM; placement force calibrated to manufacturer spec
- Reflow profile validated for the specific paste chemistry and board thermal mass; hot slump ruled out
- AOI resolution confirmed at ≤ 15 µm for 0.4mm pitch; X-ray plan in place for BGAs
The table below summarizes the five design and process tweaks with their direct impact on bridging risk, the implementation effort required, and the typical defect reduction observed.
| Tweak | Primary Bridging Mechanism Addressed | Implementation Effort | Typical Bridging Reduction | Who Owns It |
|---|---|---|---|---|
| 1. Enforce pad spacing & mask dams | Molten solder wetting across narrow gaps; no physical barrier | Low — DFM rule in CAD; fab CAM review | 40–60% reduction on fine-pitch QFPs when spacing increased from 0.1mm to 0.15mm | PCB designer / layout engineer |
| 2. Aperture reduction (80–90% pad area) | Excess paste volume; paste slumping beyond pad | Low — stencil design modification; no board change | 30–50% reduction on pitches < 0.5mm | Stencil designer / process engineer |
| 3. Area ratio ≥ 0.66 (IPC-7525) | Erratic paste transfer; inconsistent volume | Moderate — may require step-down stencil or thickness reduction | 50–70% reduction when ratio moves from 0.55 to 0.66+ | Process engineer / stencil vendor |
| 4. Placement precision validation | Paste squeeze-out from offset placement | Moderate — machine calibration; fiducial strategy | 20–35% reduction on 0.4mm pitch; higher on ultra-fine pitch | Manufacturing engineer / SMT line tech |
| 5. Comprehensive bridging-aware design review | Interaction effects (copper weight + finish + spacing) | Low — add to existing review process | Hard to isolate; prevents chronic issues that escape single-parameter checks | Cross-functional: design, process, quality |
These five tweaks are not theoretical. They represent the accumulated experience of assembly lines that have moved from reactive rework to proactive prevention. The investment in each is modest relative to the cost of a single bridge that escapes to the field — and the fastest way to end PCB assembly nightmares is to ensure the bridges never form in the first place.
Solder Bridge Troubleshooting: Questions Engineers and Buyers Ask Before Signing Off
When a board is moving toward production release, the questions shift from general principles to specific, quantitative thresholds. The following FAQ addresses the most common high-stakes queries that come up during design reviews, supplier qualification, and pre-production meetings.
Q: What is the minimum safe pad-to-pad spacing to avoid solder bridging on 0.5mm pitch QFPs?
A minimum spacing of 0.15–0.2mm between pads, combined with a well-defined solder mask dam of at least 0.1mm, typically prevents bridging on 0.5mm-pitch QFPs under normal process conditions. DFM tools should flag any spacing below 0.15mm, and IPC-7351 land patterns provide a solid baseline that balances manufacturability with density. If your design requires spacing below 0.15mm, you're entering a zone where every other process variable — stencil area ratio, paste chemistry, reflow profile — must be optimized to compensate, and bridging risk rises non-linearly.
Q: How does the choice of solder paste (no-clean vs. water-soluble) affect bridging risk?
No-clean pastes generally have lower slump characteristics and better tack retention, which reduces bridging on fine-pitch components by keeping the paste deposit confined to the pad during preheat. Their flux chemistry is designed to minimize spread before activation. Water-soluble pastes can offer more aggressive wetting, which is beneficial for joint formation on oxidized surfaces, but they require careful reflow profile control to avoid hot slump — the phenomenon where the paste collapses and spreads laterally before the flux fully activates. FCT Solder's research on paste behavior confirms that the paste choice must be matched to the reflow profile; a water-soluble paste run with a no-clean profile (or vice versa) is a recipe for bridging. For fine-pitch assemblies, no-clean paste with a well-characterized slump resistance is the safer default, but water-soluble can perform equally well if the profile is validated for that specific chemistry.
Q: Can we relax stencil thickness for fine-pitch components without causing insufficient solder joints?
Yes, but it requires a step-down stencil. Use a thinner section (e.g., 0.1mm) for fine-pitch areas while keeping the main area at 0.12–0.15mm. This maintains paste volume for larger pads — connectors, power devices, discretes — and reduces bridging risk on tight pitches. The constraint is the area ratio: even in the stepped-down zone, the area ratio must remain above 0.66 for consistent paste release. A 0.1mm-thick stencil section with a 0.15mm-wide aperture yields an area ratio of 0.75, which is comfortably above the threshold. If the stepped-down area contains apertures narrower than 0.13mm, you may need to go even thinner — but at that point, consult your stencil vendor about nano-coating or electroformed stencil technology to improve release at extreme aspect ratios.
Q: What AOI resolution is required to reliably detect bridging on micro-BGAs?
AOI systems with resolution of 10–15 microns can detect visible bridging on outer rows of BGAs and QFNs, but they cannot see under the package body. A 15-micron system, as cited by MicroLOGIX, is effective for 0.4mm-pitch QFNs and larger BGAs where the outer row joints are optically accessible. For 0.3mm-pitch micro-BGAs and any package where inner-row bridges are a concern, X-ray inspection is necessary — there is no optical workaround. If your product uses micro-BGAs and you are relying solely on AOI, you are accepting a detection gap that only X-ray can close. For Class 3 assemblies, 100% X-ray on micro-BGA placements is standard practice.
Q: How do we handle rework of solder bridges on high-density boards without damaging adjacent components?
Use a fine-tip soldering iron with controlled heat and a solder wick for bridges on exposed pads. The key is thermal control: a tip temperature of 315–345°C (600–650°F) with dwell time under 3 seconds per joint minimizes heat damage to adjacent components. For bridges in tight areas where an iron tip cannot reach safely, a precision hot-air rework station with a custom nozzle sized to the component is the better option. For bridges under BGAs or leadless packages, laser cutting or microwave treatment, as noted by PCBandAssembly, can be applied, but the board must be qualified for the thermal stress these methods introduce. After any rework, always follow with AOI or X-ray re-inspection — a reworked bridge that leaves a partial short or a damaged adjacent joint is worse than the original defect.
Q: Is there a proven correlation between stencil aperture area ratio and solder bridging defect rate?
Yes, and the correlation is well-documented. IPC-7525 recommends an area ratio above 0.66 for consistent paste release. Below that threshold, paste transfer becomes erratic — some pads receive excess paste, others receive too little — and the excess creates the conditions for bridging. Process audits across multiple assembly lines consistently show a sharp rise in bridging defect rates when the area ratio drops below 0.6. At an area ratio of 0.55, bridging rates can be 3–5× higher than at 0.66, controlling for all other variables. This is one of the few parameters in SMT assembly where a single number correlates so strongly with a specific defect, which is why stencil audit programs that measure and maintain area ratios are among the highest-return process investments available.
References & Further Reading
- Common PCB Defects: Causes, Solutions, and Prevention — MicroLOGIX
- Solder Bridging: Preventing a Common PCB Soldering Defect — JLCPCB
- A Visual Guide to Common PCB Assembly Defects (and Their Root Causes) — BENCOR
- Common Defects in PCB Assembly and How to Prevent Them — PCBCart
- Solder Bridging Issues During Assembly — FCT Solder
- 13 Common PCB Soldering Problems to Avoid — Seeed Studio
- PCB Solder Bridge Guide: Causes, Prevention & Rework — PCBandAssembly